- Role
- Solo project — test software for validating the Huia launch system
- Timeframe
- Huia programme
I developed this project to apply the computer vision and OpenCV skills I had been building to a practical measurement problem within UC Aerospace’s launch system. The test rig had no onboard sensors, meaning video was the only available source of data for determining the sled’s position, velocity, and acceleration during launch.
The initial approach used printed visual markers attached to the sled to determine its position in each frame. This worked well during early validation with lower-speed footage, where the markers remained clear and easy to identify. However, as the launch system performance increased, the approach became unreliable. Motion blur caused the markers to lose their defining features, resulting in tracking failures during higher-speed launches.
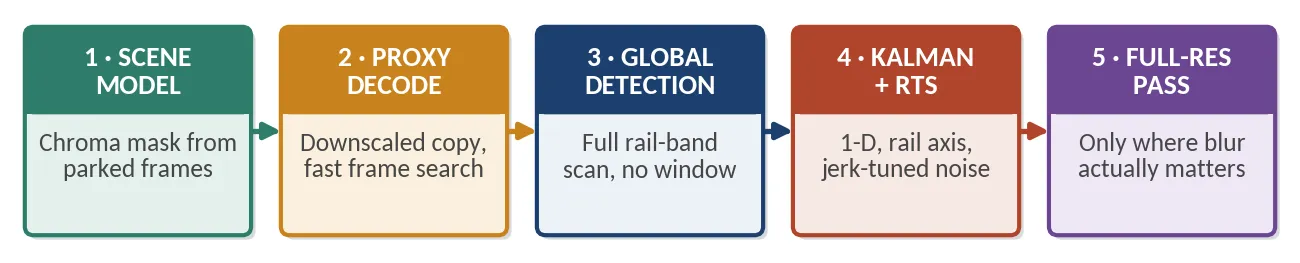
To solve this, I developed a markerless tracking approach that identifies the sled using its own colour characteristics rather than relying on printed features. The final system combines colour-based detection, image processing at multiple resolutions, and motion prediction algorithms to maintain a stable position estimate even when individual frames are unclear. The tracking system was designed to work across a wide range of recording conditions, from high-speed cameras exceeding 1000 frames per second to standard 30 fps recordings. Instead of tuning the system for one specific camera, the tracking algorithms are configured using physical motion limits, allowing the same approach to be applied across different recording speeds.
The application was developed in Python using PySide6 for the graphical interface, OpenCV for computer vision processing, NumPy for numerical analysis, and pyqtgraph for data visualisation. The software architecture separates the core measurement algorithms from the user interface, with video processing, tracking, calibration, and analysis implemented as independent modules. This allowed the underlying algorithms to be tested independently and improved the reliability and maintainability of the application.
The software includes multiple calibration methods to convert camera measurements into real-world distances and motion data. These range from simple scale measurements through to full perspective correction, accounting for camera angle and distortion in the launch setup. The application continuously tracks calibration status, preventing unscaled pixel measurements from being incorrectly reported as physical measurements.
The user interface was refined through testing with the intended operators, improving workflows for calibration, data review, plotting, and export. Video playback and export rates are independent from the original recording speed, allowing high-speed footage to be reviewed at practical speeds while preserving the accuracy of the underlying analysis.
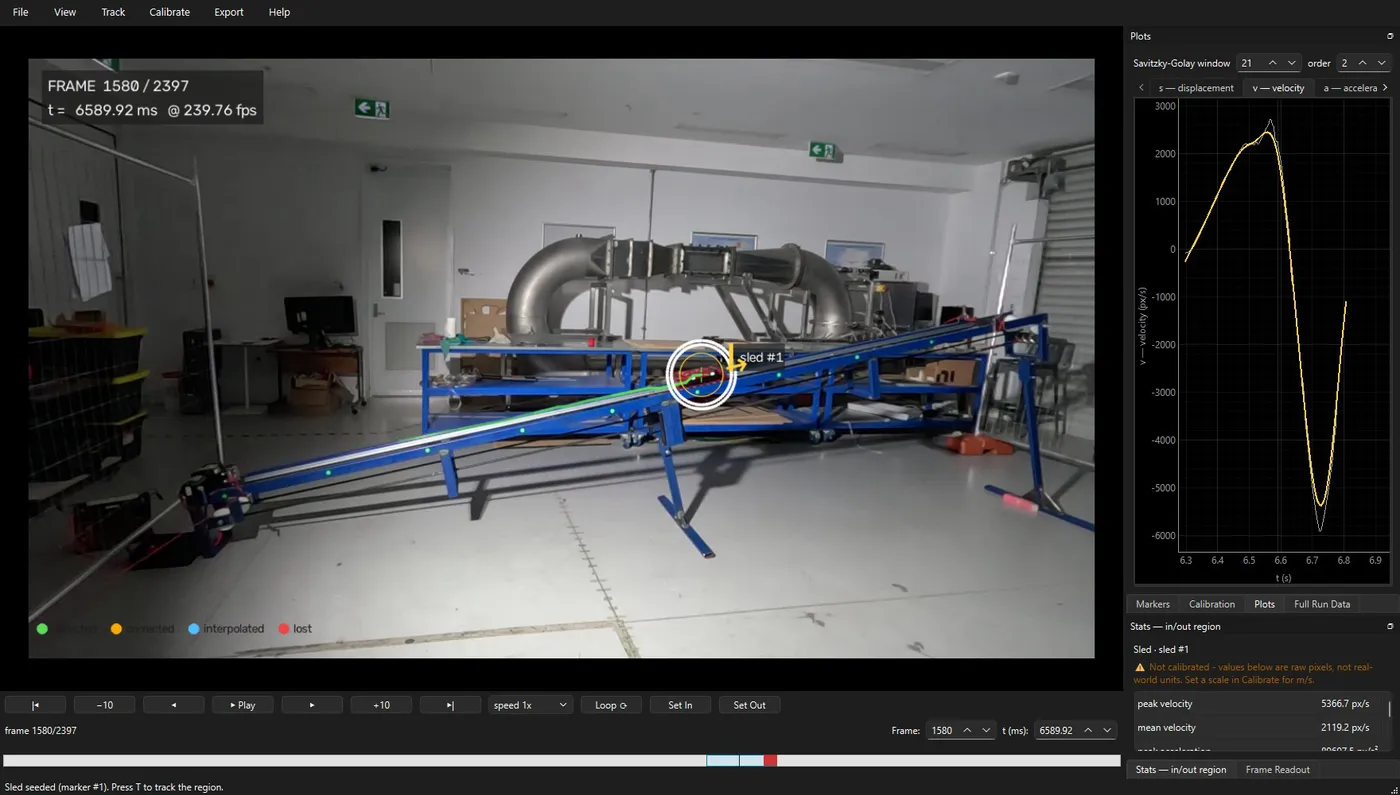
Testing combines both simulated and real-world data. A synthetic video generator was created to model the launch system geometry and motion, producing test footage with known ground-truth results for repeatable validation. This was combined with real launch footage from multiple cameras, which exposed practical issues such as incorrect camera metadata, inconsistent frame rates, and tracking failures caused by real-world conditions. Automated tests cover both individual processing functions and complete application workflows from video import through to final data export.
Simulated testing verified the algorithms were mathematically correct, but real footage surfaced the problems that actually mattered: motion blur, unreliable camera metadata, and recording behaviour no clean synthetic clip would ever produce. Fixing those turned this into a measurement tool robust enough for future launch system testing.
Technologies
Key outcomes
Developed a computer vision system to measure sled position, velocity, and acceleration during launch testing using only camera footage. Replaced a marker-based tracker with a colour-based tracking pipeline using chroma modelling, Kalman filtering, RTS smoothing, and full-resolution refinement, enabling reliable operation from standard 30 fps cameras through to high-speed footage exceeding 1000 fps. Testing with real launch footage identified failure modes including motion blur and inaccurate camera metadata.